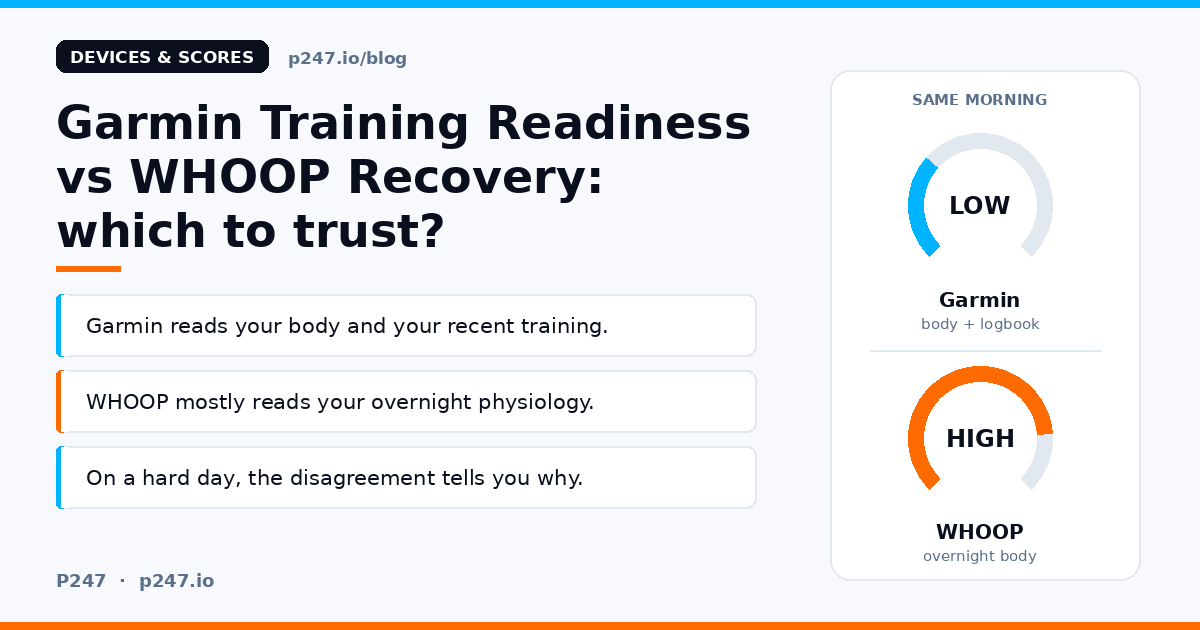
Garmin Training Readiness and WHOOP Recovery look like the same thing. A number each morning, a colour, and a hint about whether today should be hard. They are not measuring the same thing.
Garmin’s score mixes overnight signals with your recent training: how much load you have built up, and how much recovery time your last sessions left behind. WHOOP’s score is built from your overnight physiology: HRV first, then resting heart rate, sleep and respiratory rate. Your training reaches it mostly through what it did to your body overnight.
So on a hard day, the short answer is:
- If both say low, believe them. Two different methods agreeing is the clearest signal either device will give you.
- If Garmin is low and WHOOP is green, check why Garmin is low. If it is acute load and recovery time in a week you planned to be hard, the score is doing what it was built to do. It does not mean your body failed to recover.
- If WHOOP is red and Garmin looks fine, your overnight physiology has flagged something your training log cannot explain. Take that one more seriously.
On HRV accuracy, independent studies have found WHOOP’s overnight HRV agrees more closely with a chest strap or ECG than Garmin’s. But the studies are small, they tested older models, and they tested the HRV number, not the score you see each morning.
If you are still deciding which device to buy, start with Garmin or WHOOP for endurance athletes. This post is narrower. You already own one or both, and you want to know which score to listen to before a key session.
What goes into Garmin Training Readiness
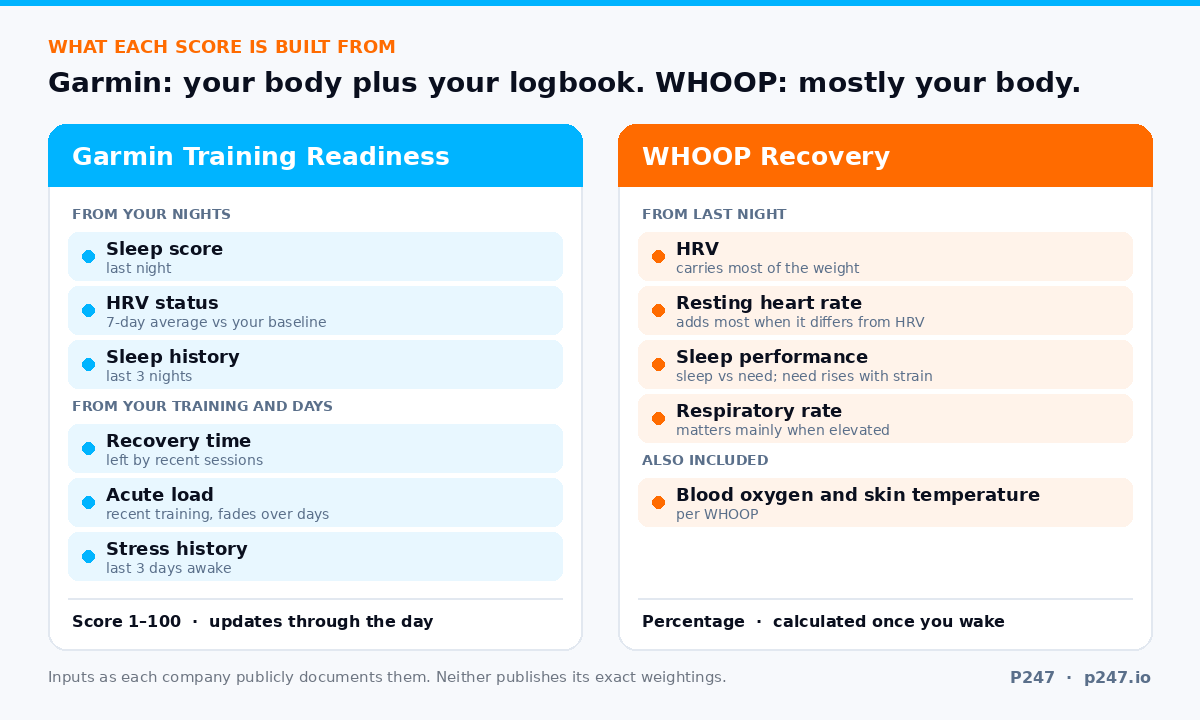
Garmin’s owner’s manual lists six factors:
- Sleep score (last night)
- Recovery time
- HRV status
- Acute load
- Sleep history (last three nights)
- Stress history (last three days)
The score runs from 1 to 100, from Poor up to Prime, and Garmin says it is continuously calculated and updated throughout the day. So it is not a single morning verdict. Do a hard session at lunchtime and the number will be lower by the afternoon.
HRV status, one of those six inputs, is a trend rather than a single night. The watch measures HRV while you sleep, needs three weeks of consistent sleep data to build your baseline, and then compares your seven-day average with that baseline. Garmin also counts a seven-day average above your range as “unbalanced”, not just one below it. That fits the research showing HRV can rise during heavy training, which I covered in HRV and overtraining.
The part that matters on a hard day: two of the six factors, recovery time and acute load, come from your training rather than your overnight physiology. Garmin’s readiness score knows you did a big session yesterday, because it recorded it.
What goes into WHOOP Recovery
WHOOP lists heart rate variability, resting heart rate, sleep performance and respiratory rate as the inputs to Recovery, and says blood oxygen and skin temperature are included as well. The score is a percentage: green from 67%, yellow from 34% to 66%, and red at 33% or below. It is calculated once you wake up.
WHOOP is open about the inputs not being equal. In an episode of its own podcast, the company explains that HRV carries most of the predictive value, and that resting heart rate and sleep matter most when they stop moving in line with HRV. Respiratory rate was added later, and WHOOP says it usually does not move your score unless it is elevated above your normal.
Your training is not a direct input. It gets in indirectly. WHOOP’s sleep need goes up with strain, so a big day raises the bar for sleep performance. And a session that knocks your HRV down or pushes your resting heart rate up overnight will show up. But if your physiology bounces back overnight, WHOOP can give you a green the morning after a session that Garmin is still counting against you.
Body, or body plus logbook
Garmin Training Readiness reads your body and your training log. WHOOP Recovery mostly reads your body.
Neither approach is wrong. They just fail in different ways.
Garmin can stay low after you have absorbed the work. Acute load fades over days, not overnight, so after a big block the score can keep pointing down even when you feel good. It also only counts the training it knows about. A session that never made it into Garmin Connect cannot count. And heart rate can undersell what a heavy sled push or a long set of lunges cost your legs, which matters a lot in a HYROX week.
Garmin can also be slow to react to a single bad night. Last night’s sleep score moves it straight away, but HRV status is a seven-day average, so one rough night shifts it less than it shifts a score built mostly on last night’s HRV.
WHOOP can say green when your legs disagree. Overnight HRV and resting heart rate are heart signals. They do not see sore quads.
WHOOP can be swung by a strange HRV night. Because Recovery leans so heavily on HRV, one odd reading matters. WHOOP’s head of data science acknowledged on its community forum in August 2025 that unusually high HRV readings are often not a sign of better recovery, and that it was a current limitation of the algorithm that they could produce an overly green score and skew your averages for weeks. WHOOP said it was working on it, but it is a good reminder of how much one number is carrying.
Which one to trust on a hard day
Here is how I would read them before a key session: intervals, a long run with race-pace work, a big ride, or a HYROX simulation.
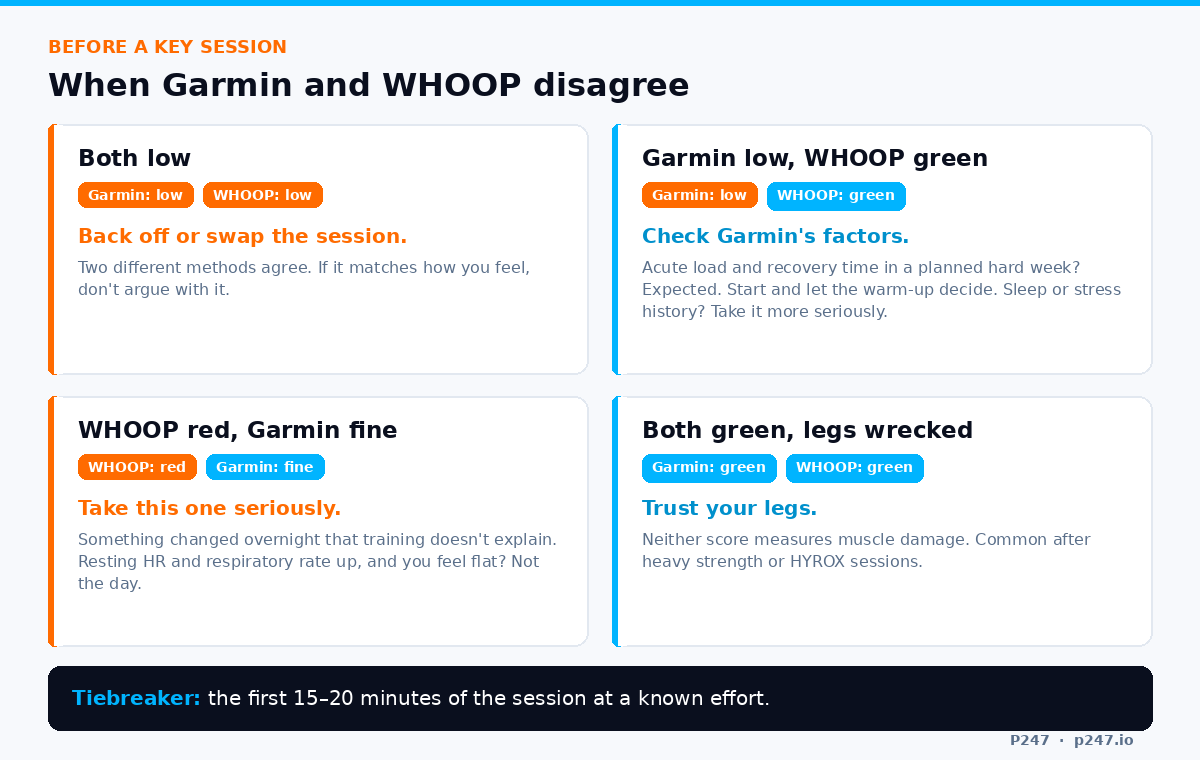
Both low. Back off or swap the session. If that lines up with how you feel, do not argue with it.
Garmin low, WHOOP green. Open Garmin’s readiness screen and look at which factors are pulling it down. If it is acute load and recovery time in a week you deliberately made hard, the score is telling you something you already knew, and your overnight physiology looks fine. I would start the session and let the warm-up decide. If it is sleep history or stress history dragging it down instead, that is a different story, and I would take it more seriously.
WHOOP red, Garmin fine. This is the combination I respect most. Something changed overnight that your training does not explain: a bad night, illness coming on, alcohol, a hot night, travel or work stress. Check whether your resting heart rate and respiratory rate are up as well. If they are, and you feel flat, today is not the day for the key session.
Both green, legs wrecked. Trust your legs. Neither score measures muscle damage. This happens a lot after heavy strength or HYROX sessions.
The tiebreaker is a known effort. When the scores disagree, the most useful data you have is the first 15 to 20 minutes of the session itself. If your usual warm-up pace or power feels normal at your usual heart rate and effort, carry on. If it feels much harder than it should, cut it short or turn it into an easy day.
How accurate is each for HRV?
Both devices measure HRV at the wrist with an optical sensor while you sleep. WHOOP calculates HRV as RMSSD, a standard measure of beat-to-beat variation. To check how close these readings are, researchers compare them with a chest strap or ECG worn at the same time.
Two independent studies are worth knowing about.
Dial and colleagues, 2025. In a study in Physiological Reports, 13 healthy adults wore several devices at home, with a Polar H10 chest strap as the reference, for 536 nights in total. For HRV, WHOOP 4.0 showed moderate agreement with the reference (a concordance of 0.94 and an average error of about 8%). The Garmin Fenix 6 showed poor agreement (0.87, and about 10.5%). The Oura rings did best of all. The study was funded by the US Air Force Research Laboratory, and the authors declared no competing interests.
Miller and colleagues, 2022. In a study in Sensors, CQUniversity researchers funded by the Australian Institute of Sport tested six devices on 53 adults over one night in a sleep lab. WHOOP 3.0’s HRV showed excellent agreement with ECG, reading about 4.5 ms low on average. Garmin did poorly, but its HRV came from a three-minute test taken while awake, not the overnight reading Garmin uses for HRV status, so it says little about how Garmin measures HRV today. The authors disclosed that their research group receives support from WHOOP, and stated that WHOOP had no role in the study.
WHOOP’s HRV page describes that second study as showing WHOOP is “99% accurate” for HRV. The paper’s figure for WHOOP’s HRV was an intraclass correlation of 0.99, a measure of how well the readings tracked the reference across the group. That is not the same as every reading being within 1% of the true value.
So what can you actually take from this?
- On the current evidence, WHOOP’s overnight HRV number sits closer to a reference than Garmin’s. That is a fair point in WHOOP’s favour.
- The Garmin evidence is thin and dated. The overnight comparison used a Fenix 6. Garmin has released newer optical sensors since, and that study did not test them.
- The samples are small and healthy. 13 people at home and 53 people for one night in a lab. Useful, but not the last word, and not necessarily true for your wrist.
- Neither study tested the score. Dial and colleagues point out that there is little transparency into what drives each device’s readiness or recovery score, and that the algorithms can change with updates. An accurate HRV number does not make the score built on top of it right.
What accuracy means in practice
A slightly noisy HRV number is fine if you only ever compare it with itself. These are the things that cause real problems:
- Comparing Garmin’s milliseconds with WHOOP’s. They use different measurement windows and different processing, and the companies do not fully explain how they filter bad data. Pick one device as your HRV source and stick with it.
- Reacting to one night. Watch the seven-day trend against your normal range. That is exactly what Garmin’s HRV status does, and it is the right instinct. I have written more on why the trend matters more than today’s number.
- Splicing data. A new device, a new strap position or a loose fit needs time to settle into its own baseline before you compare it with the old one.
The point
Neither score is “the right one”. Garmin answers: given what you have done lately and how you have slept, how ready are you? WHOOP answers: how well did your body recover overnight?
On a hard day you want both questions answered, plus one neither device can answer. Where are you in your plan, and how much does this session matter? A low score in a deliberate overload week three weeks out from your marathon means something different to the same score in race week.
That third question is the gap I built P247 for. Each morning it gives you a daily brief with a recovery score, and each week a report for the bigger calls: what is working, what is holding you back, and what to change. P247’s own recovery score gets the same treatment as Garmin’s and WHOOP’s. It is one input, read next to your training, not a verdict on its own.
P247 does not connect to Garmin or WHOOP directly. It works from Apple Health, with Strava as an optional extra, so it reads whatever your devices share through Apple Health or Strava. Your first report is free.
P247 is launching on the App Store at the end of November, with Android to follow in 2027. If you want in early, join early access here.